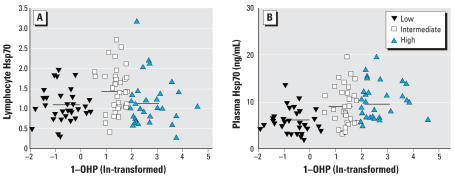
Figure 2.
Scatter plots of lymphocyte and plasma Hsp70 to urinary 1-OHP by different internal exposure. (A) Lymphocyte Hsp70 (relative amount of GADPH measured by integral optical density) to urinary 1-OHP: the mean levels of lymphocyte Hsp70 were 1.08 ± 0.39 for the low-exposure group, 1.39 ± 0.88 for the intermediate-exposure group, and 1.10 ± 0.55 for the high-exposure group. (B) Plasma Hsp70 (geometric mean, ng/mL) to urinary 1-OHP. Plasma Hsp70 levels increased as the exposure increased (ptrend = 0.044), with the highest plasma Hsp70 (9.74 ± 3.87 ng/mL) in the high-exposure group and the lowest plasma Hsp70 (5.97 ± 2.22 ng/mL) in the low-exposure group.

