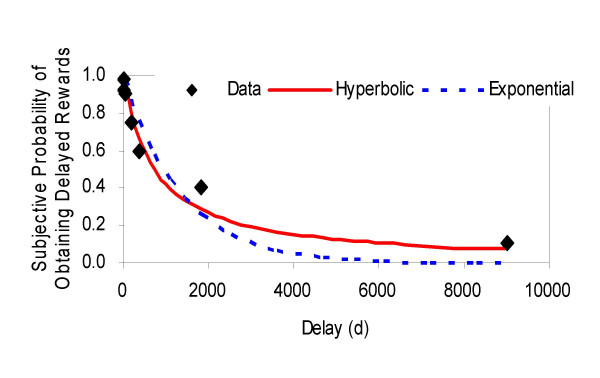
Figure 2.
Vertical axis indicates group median of SP(D) (i.e., subjective probability of obtaining a reward at delay D) and horizontal axis indicates delay (days). The solid (red) and dotted (blue) curves are the hyperbolic and exponential functions respectively, best fitted to the SP(D) obtained in SPQ (see Methods). Note that hyperbolic decay model (red) proposed by Sozou [13] better fit data than exponential decay model (blue) (see Table 1 for AICc for each model).

