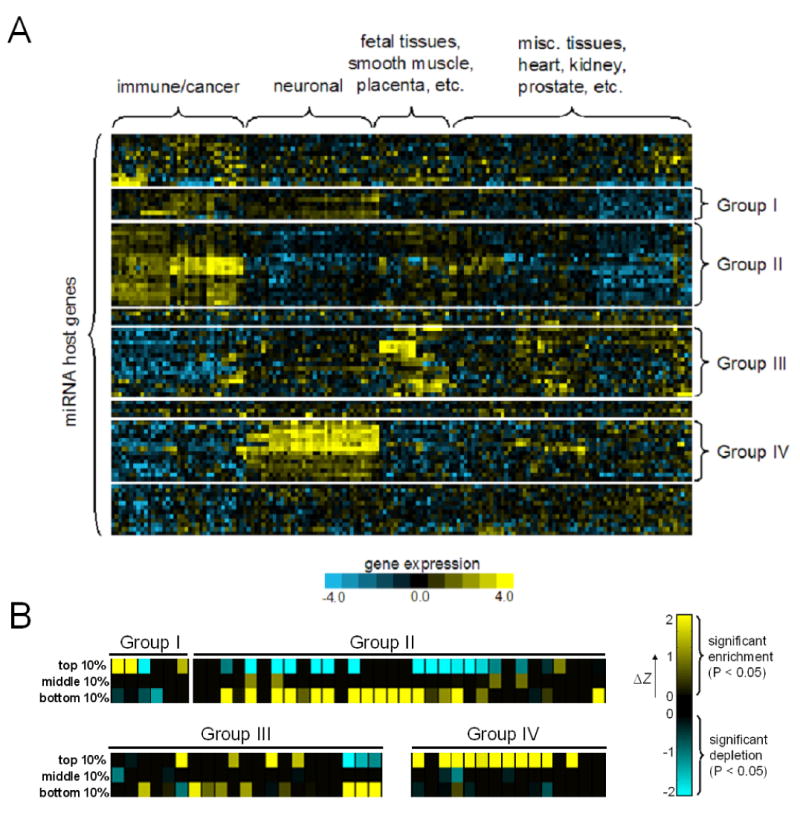
Figure 2. Targeting Bias Analysis of Human Embedded miRNAs.

(A) The expression profiles of human embedded miRNA host genes in the Novartis atlas. Four prominent clusters were identified by hierarchical clustering.
(B) Targeting bias enrichment scores of miRNAs from major expression clusters. The color scale reflects the degree of deviation from the 5% significance level (ΔZ), while black denotes insignificant enrichment/depletion (i.e. P>0.05).
