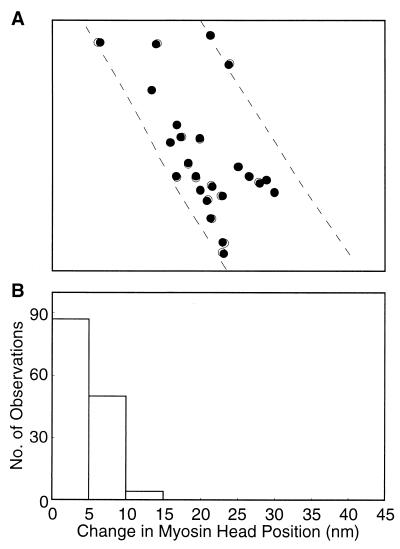
Figure 3.
Stability of the myosin head position in the ATP-free experimental solution. (A) Comparison of the myosin head positions between the two records of the same filament on the common coordinates. Filled and open circles (diameter, 15 nm) are drawn around the center of mass position of each particle in the first and the second records, respectively. Broken lines indicate the contour of the filament on which the particles are located. (B) Histogram showing the distribution of distance between the two center of mass positions of the same particles in the first and the second records.

