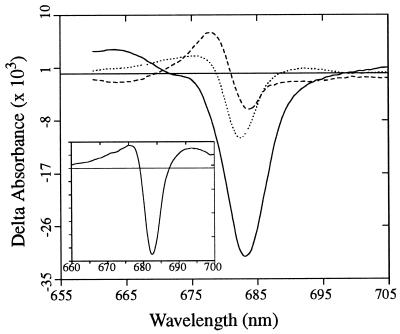
Figure 2.
DAS at T = 20 K of the 2.6-ps (dotted line), 120-ps (dashed line), and 2-ns (solid line) components. (Inset) DAS spectrum of the component that follows the excitation pulse instantaneously and which is responsible for a ΔOD of 14.10−3 at the maximum of the instrument response. At all temperatures such a component was included in the fit.

