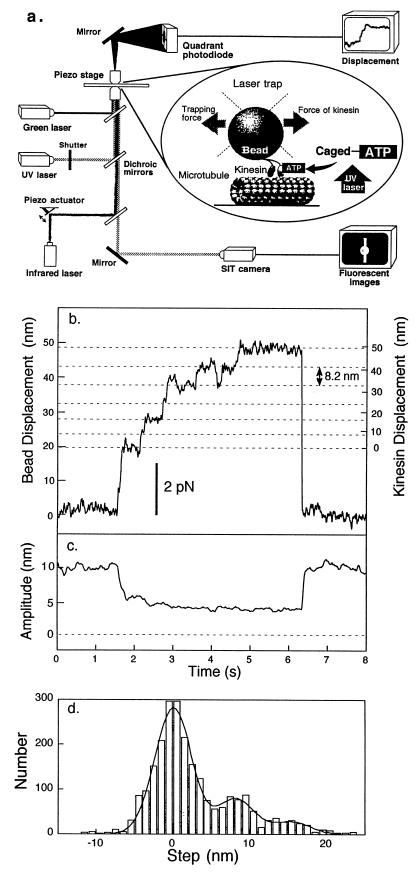
Figure 1.
Measurement of force and displacement of single kinesin molecules. (a) Diagram indicating the experimental arrangement for laser trapping nanometry of displacement and force generation by single kinesin molecules activated by flash photolysis of caged ATP. (b) Measurement of stepwise movement of a single kinesin molecule at 20 μM ATP. Force was calculated from displacement of the bead multiplied by the trapping stiffness of 0.18 pN⋅nm−1. The displacement of kinesin, right axis, was determined from the bead displacement, left axis, by correcting for the kinesin-to-bead stiffness shown as follows. (c) Determination of kinesin-to-bead stiffness. The amplitude of displacement change of the bead was measured when the center of the trap was sinusoidally vibrated at 500 Hz with a peak-to-peak amplitude of 10 nm. The sinusoidal amplitude decreases when kinesin binds to the microtubule. Kinesin-to-bead stiffness (kL) was given by the initial peak-to-peak amplitude (10 nm) and the peak-to-peak amplitude (x nm) during force generation as kT(10 − x)/x, where kT is the trapping stiffness. The kinesin displacement is given by db⋅ [(kL + kT)/kL] = db⋅ [10/(10 − x)], where db is displacement of the bead. (d) Histogram of step size. A 100-ms window is moved every 5 ms, and the net displacement of kinesin during the window was measured at 20 μM ATP. The histogram was fitted with the sum of three Gaussian distributions.

