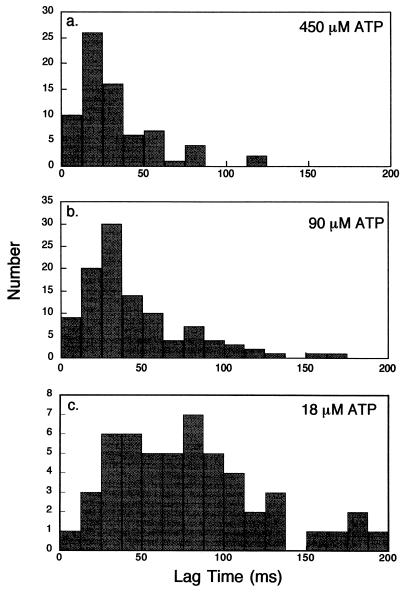
Figure 3.
Histogram of the lag times before displacements occurred. The lag time, measured between the opening of the shutter on the UV laser until the displacement reached 4-nm displacement within the first 8-nm step. The signals of the opening of shutter and the displacement were recorded through 200-Hz low pass filters. Although both signals were retarded by the filter, the lag time was not affected by it. Time bins were 12.5 ms. The final concentration of released ATP was 450 (a), 90 (b), and 18 μM (c).

