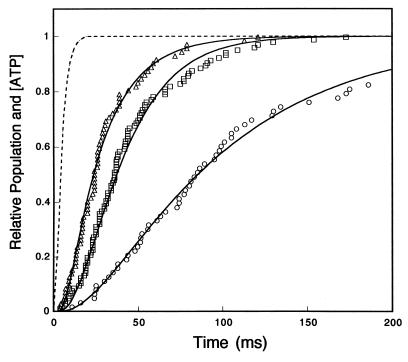
Figure 4.
Kinetic analysis of displacement transients. Dotted line, time course of the increase in ATP concentration after opening of the shutter relative to the final concentration of ATP calculated as described in Materials and Methods. Time courses of the accumulation of kinesin molecules in the force-generating state at released ATP concentration of 450 (▵), 90 (□), and 18 μM (○). The time courses were obtained by integrating the histograms of the lag times in Fig. 3 using 1-ms time bins. The solid lines are the best fits of the data to a two-step reaction (Eq. 2, kATP = 0.7 μM−1⋅s−1, kf = 45 s−1) after ATP release from caged ATP. At significance level of 5% in χ2 test (27), data were fitted to these curves, but not to curves simulated from a model for one-step reaction assuming kf ≫ kATP.

