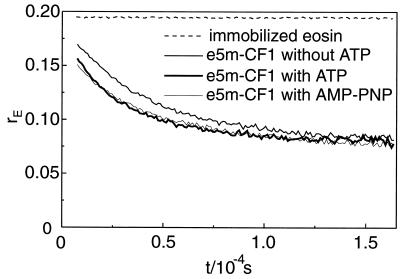
Figure 4.
Transients of the phosphorescence anisotropy of eosin, rP(t), after a laser flash at t = 0. Samples were illuminated repetitively by 1,000 laser flashes (density 10 μJ/cm−2). Data points are the average of six samples (excitation at λ = 532 nm, detection at λ > 645 nm). Upper trace, totally immobilized eosin in polyacrylamide. Three superimposed lower traces, Immmobilized and γ-labeled CF1 with ATP, with AMP-PNP and without added nucleotide. Other conditions are as in Fig. 3 and see Materials and Methods.

