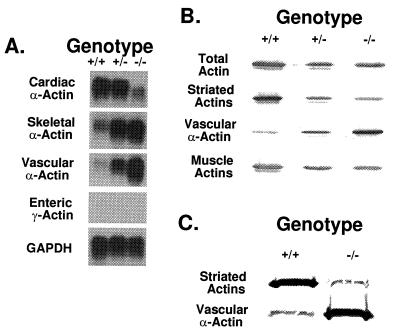
Figure 2.
Expression profiles of actin mRNA and protein from +/+, +/−, and −/− newborn mouse hearts. (A) Total heart RNA was analyzed for the expression of the different muscle actins. GAPDH was used as a control for the amount of RNA loaded. The minor band seen in the −/− heart includes transcripts deleted for sequences downstream of the HPRT insertion site (not shown). Note the increase in skeletal α-actin and vascular α-actin mRNA in the +/− and −/− hearts compared with the +/+ heart. Enteric SMGA expression is not observed in any of the three newborn hearts. (B) Total heart extracts were fractionated on an SDS/12% polyacrylamide gel and transferred to nitrocellulose. The actins were stained with different mAbs (C4 for total actin, 5C5 for the striated actins, 1A4 for vascular smooth muscle α-actin, and HUC 1–1 for muscle actin). Vascular smooth muscle α-actin shows an inverse correlation with cardiac α-actin gene dosage. The minor band seen in the −/− heart must represent skeletal α-actin, since mAb 5C5 recognizes both this isoform and cardiac α-actin. (C) Myofibrillar protein was similarly analyzed for its actin composition with the mAbs 1A4 and 5C5.

