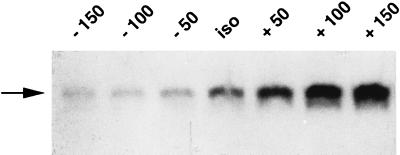
Figure 3.
h-sgk transcript levels in dependence of extracellular osmolarity. Prior to total cytoplasmic RNA isolation, HepG2 cells were kept in hypotonic (minus 50, minus 100, and minus 150 mosmol/liter) and hypertonic (+ 50, + 100, and + 150 mosmol/liter) solution for 2 hr. The basal expression under isotonic conditions (iso, 290 mosmol/liter) is shown in the middle lane. Arrow indicates the single 2.6-kb h-sgk transcript.

