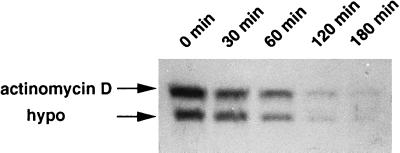
Figure 5.
Decrease of h-sgk transcript levels upon hypotonic treatment or addition of actinomycin D. HepG2 cells were treated with hypertonic medium (390 mosmol/liter) 2 hr prior to the addition of actinomycin D (5 μg/ml) or transfer to hypotonic medium (hypo, 190 mosmol/liter). RNA was isolated at the time points indicated. Each slot of the gel was loaded two times with 20 μg of total cytoplasmic RNA with an interval of 15 min between the two loadings. The upper and the lower row represent the time course of the decrease of h-sgk transcript levels after addition of actinomycin D or after lowering the extracellular osmolarity, respectively.

