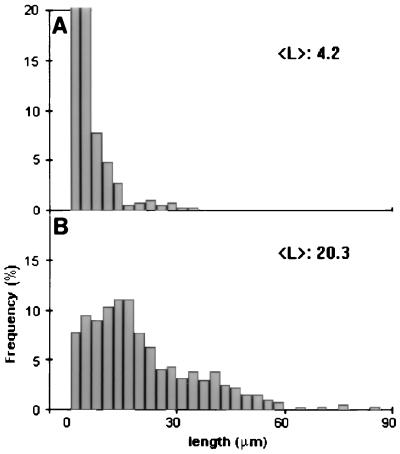
Figure 3.
Length distribution of microtubules formed in the absence or presence of MAP60. The analysis was performed on samples from the assembly assay shown in Fig. 2. Controls were: (A) 25 μM rhodamine-tubulin without MAP60 and (B) 25 μM rhodamine-tubulin with 0.2 μM MAP60.

