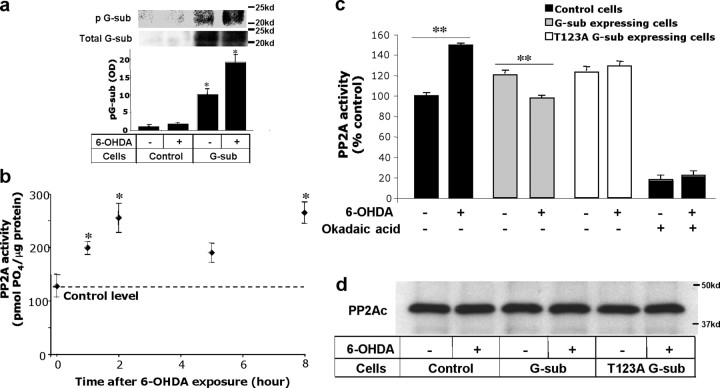
Figure 4.
Changes in phosphorylated G-substrate and PP2A activity after 6-OHDA exposure. a, G-substrate was immunoprecipitated from control and G-substrate-expressing cells, and phosphorylated and total G-substrate levels were measured in the absence or presence of 6-OHDA treatment. G-substrate overexpression caused an increase in phosphorylated G-substrate levels in the basal conditions, which was further augmented by 6-OHDA exposure. To quantify the levels of phospho-G-substrate, optical densities (OD) of the phospho-G-substrate levels in each condition was normalized with basal (no 6-OHDA) phosphorylated G-substrate in control cells. Statistical comparisons were made against no 6-OHDA control cell conditions (n = 3, *p < 0.01, two-tailed t test). b, PP2A activity was measured at various times (t = 0, 1, 2, 5, and 8 h) on BE(2)-M17 cells after 50 μm 6-OHDA treatment. Exposure to 6-OHDA induced an increase in PP2A activity at all times except t = 5 h. Data are shown as means ± SEM (n = 3). Statistical comparisons were made against baseline control values at t = 0 h (*p < 0.05, two-tailed t test). c, PP2A activity was measured in control, wild-type, and T123A G-substrate-expressing cells after exposing cells to 50 μm 6-OHDA for 2 h. The results are expressed as a percentage of the basal (no 6-OHDA condition) activity of the control cells. Surprisingly, overexpression of the wild-type and T123A G-substrate increased the basal PP2A activity (c). In response to 6-OHDA exposure, the wild-type G-substrate significantly reduced the observed 6-OHDA-induced PP2A activity increase. The degree of reduction in T123A G-substrate-expressing cells was significantly lower than the wild-type-expressing cells. For okadaic acid-treated conditions, 1 nm okadaic acid was applied for 30 min before harvesting the cells for PP2A activity measurement. Data are shown as means ± SEM of five independent experiments (**p < 0.005, two-tailed t test). d, Western blot analysis of immunoprecipitated PP2A indicates that the activity changes shown in b were not attributable to alterations of PP2A protein levels.

