
Figure 2. CNC cell migration into Meckel’s cartilage is not affected by loss of Tgfbr2.
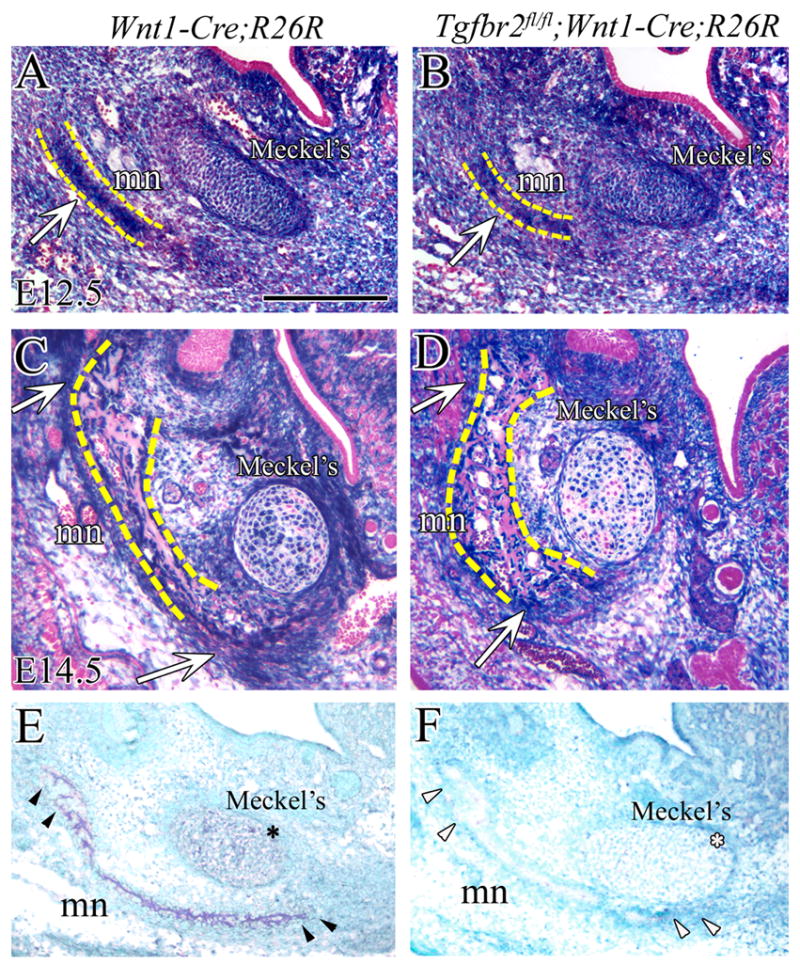
CNC cells are (blue) visualized by X-gal staining of the mandible at E12.5 (A,B) and E14.5 (C,D) in R26R;Wnt1-Cre (control) and Tgfbr2fl/fl;R26R;Wnt1-Cre mice. (A,B) At E12.5, CNC-derived cells are detected in Meckel’s cartilage and the mandible primordium (arrow). There is no apparent difference in the population of cells in Meckel’s cartilage and mandible bone of R26R;Wnt1-Cre and Tgfbr2fl/fl;R26R;Wnt1-Cre mice. (C,D) At E14.5, the Meckel's cartilage is composed of CNC-derived and non-CNC-derived cells. The staining reveals the high density of CNC-derived cells in the osteogenic front of the mandible primordium (arrow). Yellow dashed lines indicate the mandible bone primordium (A,B) or the mandible bone (C,D). (E and F) In situ hybridization shows that Tgfbr2 is expressed (dark blue) in Meckel’s cartilage (*) and in the mandibular primordium (arrowhead) in the control (E) while it is not detectable in the Tgfbr2fl/fl;Wnt1-Cre sample (F) at E13.5. Scale bar: 200μm in A–D. mn; mandible, Meckel’s; Meckel’s cartilage.