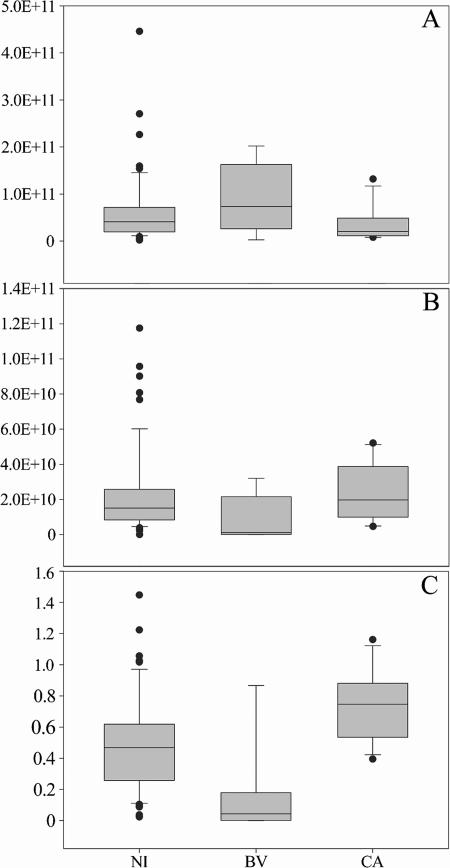
FIG. 6.
Real-time PCR evaluation of 16S rrn operons of total eubacteria (A) and lactobacilli (B) and relative abundance of lactobacilli (C) related to each group of visits characterized by a specific clinical status (NI, BV, and CA). The number of operons in 1 ml of vaginal rinsing is expressed as an absolute value. Lactobacillus relative abundance is expressed as the ratio of lactobacillus rrn operons to total eubacterial 16S rrn operons. The box for each group represents the interquartile range (25th to 75th percentile), and the line within this box is the median value. The bottom and top bars indicate the 10th and 90th percentiles, respectively. Outlier values are indicated (black circles).

