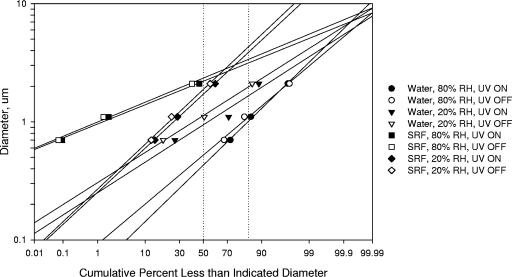
FIG. 3.
Log probability plot of vaccinia virus aerosol particle size distribution. Vaccinia virus stocks were suspended in either water or SRF and aerosolized, with or without UVC exposure, at low and high RHs. The dotted vertical lines at 50% and 84% are used to determine the median and the geometric standard deviation.

