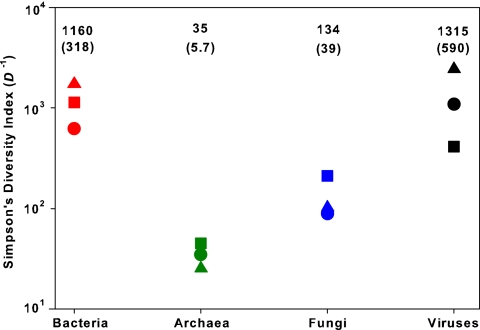
FIG. 3.
Predicted values of Simpson's diversity index for each of the 12 communities. Since Simpson's index (D) is defined as the probability that two individuals taken at random from the community belong to the same species (or, in this case, OTU) (41), higher values of D−1 indicate higher overall diversity. Symbols correspond to soil type (▴, prairie; ▪, rainforest; •, desert). The mean value for D−1 (with one standard error in parentheses) for each taxonomic group is denoted above each set of symbols.

