
FIG. 1.
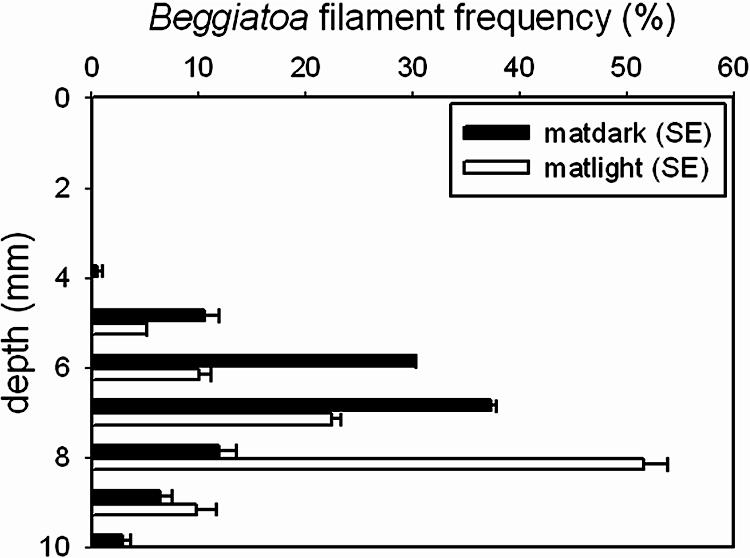
Depth distribution of Beggiatoa filaments in a microbial mat after 10 h of dark and 14 h of light incubation (500 μmol photons m−2 s−1). The data shown are frequencies (%) with standard errors (SE). Black bars, incubation in the dark; white bars, incubation in the light.