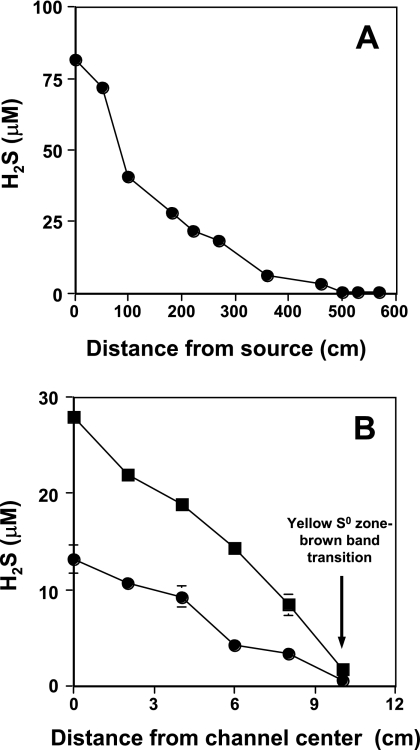
FIG. 2.
Quantifying Dragon Spring H2S gradients. (A) H2S concentration decreasing with increasing distance from the spring source along the main flow channel. (B) H2S concentration as a function of distance perpendicular to stream flow beginning at the center of the outflow channel and corresponding to transect site 4 (▪) and transect site 5 (•). For both panels, data points represent the mean of three samples, with error bars (where visible) representing 1 standard deviation of the mean. Samples for panel B were taken on a separate sampling trip, and thus maximum values at the channel center do not exactly correspond to those plotted in panel A.

