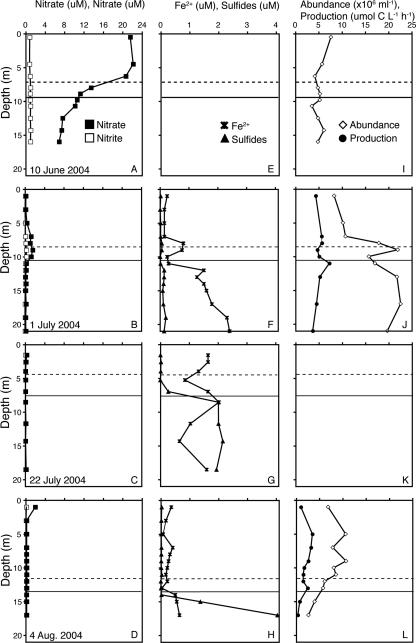
FIG. 1.
Depth profiles of the nitrate and nitrite concentrations (A to D), reduced iron and sulfide concentrations (E to H), and bacterial abundance and carbon production (I to L) on each sampling date. The dashed horizontal lines indicate the upper depth of the hypoxic layer (<3 mg liter−1 oxygen). The solid horizontal lines indicate the upper depth of the anoxic layer (oxygen concentration below the detection limit, 0.5 mg liter−1). An absence of data indicates that measurements were not obtained.

