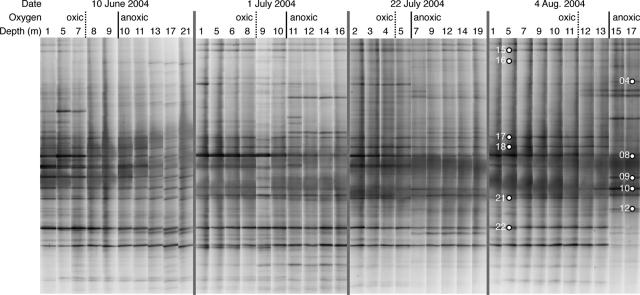
FIG. 5.
DGGE banding patterns for each depth on each sampling date. The oxygen conditions at each depth are indicated. The dashed vertical lines indicate the upper depth of the hypoxic layer (<3 mg liter−1 oxygen). The solid black vertical lines indicate the upper depth of the anoxic layer (oxygen concentration below the detection limit, 0.5 mg liter−1). DGGE bands analyzed with DNA sequencing are indicated. Bands 1 and 13 were off the image for the 17- and 5-m samples collected on 4 August, respectively.

