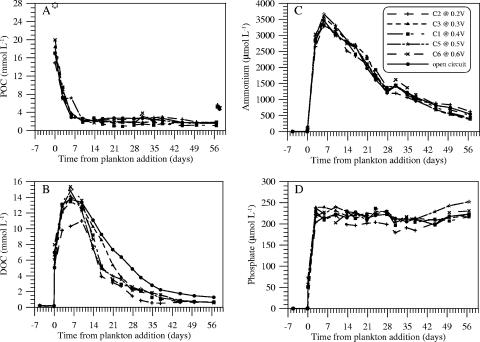
FIG. 3.
Time courses of POC (A), DOC (B), ammonium (C), and phosphate (D) in cells 1 to 3 and 5 to 7. The identification of symbols and lines is the same in all panels. In panel A the star at day 0 corresponds to initial POC concentrations computed from the weight of plankton added, its dry/wet weight ratio, and the OC content of dry material. Final data points in panel A were measured after vigorous resuspension of all particulate materials adhered to the anode arrays. These points are on average 3.5 mmol liter−1 greater than the prior time points before resuspension.

