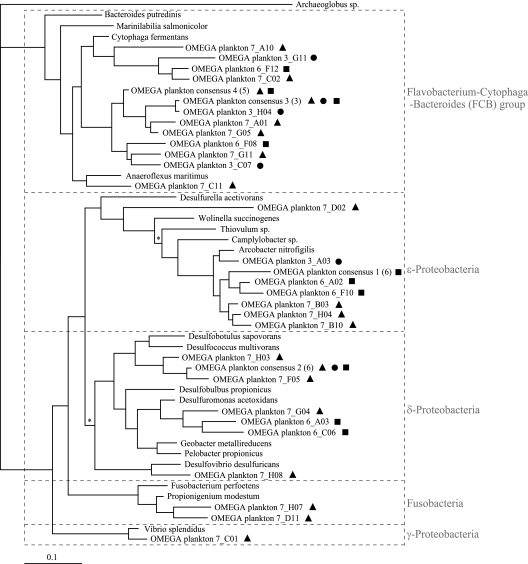
FIG. 9.
Phylogenetic tree constructed by Bayesian analysis, showing dominant phylotypes from anodes of plankton-fed MFCs. Trees constructed with other reconstruction algorithms (distance, parsimony, and maximum likelihood) resulted in the same overall topology. Archaeoglobus sp., an archaean, was used as the outgroup. Symbols denote sequences recovered from individual fuel cells held at 0.3 V (dots), 0.6 V (squares), and open circuit (triangles). Consensus sequences are indicated, and the number of individual sequences contributing is shown in parentheses. In some instances consensus sequences are followed by more than one symbol, indicating that the sequences from which they are composed were recovered from more than one fuel cell. Posterior probabilities were 1 except as indicated by the asterisk (0.5).

