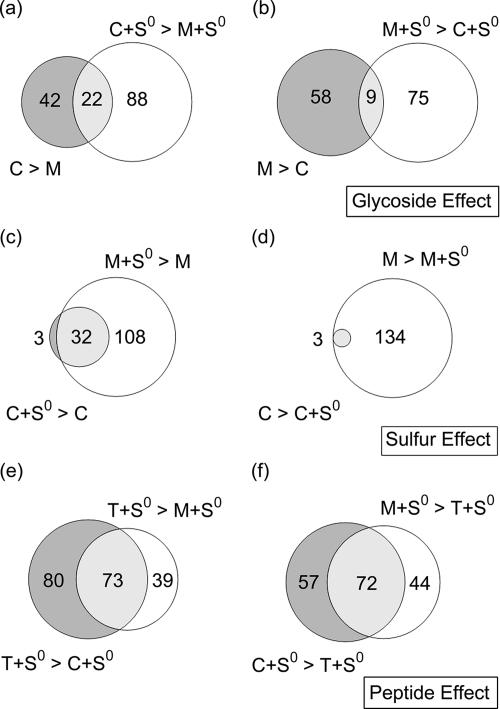
FIG. 1.
Venn diagram analysis showing the numbers of genes regulated twofold or more (a) on cellobiose (C) (C and C+S0) compared to maltose (M) (M and M+S0), (b) on maltose (M and M+S0) compared to cellobiose (C and C+S0), (c and d) in the presence of S0, and (e and f) on tryptone (T) plus S0 (T+S0). For example, in panel a, 64 genes (in the absence of S0) and 110 genes (in the presence of S0) were up-regulated twofold or more on cellobiose compared to maltose; 22 genes were common to both comparisons. See Tables 2 to 4 and the supplemental material for the complete lists.

