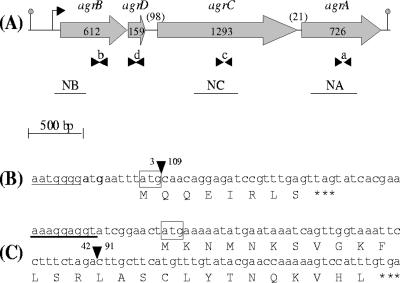
FIG. 1.
(A) Schematic diagram of L. monocytogenes agr operon. The gray arrows indicate the orientation and the size in base pairs of the four genes. Numbers between parentheses indicate the size in base pairs of the two intergenic regions. Arrowheads indicate the positions of the oligonucleotides used for real-time PCR: b (BR2; BF2), d (DF2; DR2), c (CF2; CR2), and a (AF2; AR2). The black lines indicate the probes used for Northern blotting (NB, NC, and NA). The position of the transcription initiation site and the transcription termination site are indicated, respectively, by the bent arrow and the gray dot. (B and C) DNA and deduced amino acid sequences of agrA gene containing a 106-bp deletion in DG125A (ΔagrA) mutant (B) and of agrD gene containing a 49-bp deletion in DG119D (ΔagrD) mutant (C). The position of the deletion is represented by an inverted black triangle, the nucleotides before and after the deletion are mentioned, the ribosome binding sites are underlined, the start codons are boxed, and the stop codon is represented by three asterisks.

