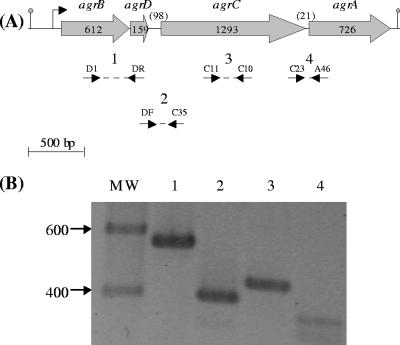
FIG. 5.
RT-PCR analysis of RNA from L. monocytogenes cells at mid-exponential phase (OD600 of 0.4). (A) The dotted lines enclosed by arrows indicate the positions of the primers and PCR products. (B) The amplified products, lane numbers 1 to 4, were separated by electrophoresis on 1% agarose gel and correspond, respectively, to the expected sizes of 567, 388, 435, and 353 bp. The sizes of the DNA marker fragments are indicated in base pairs.

