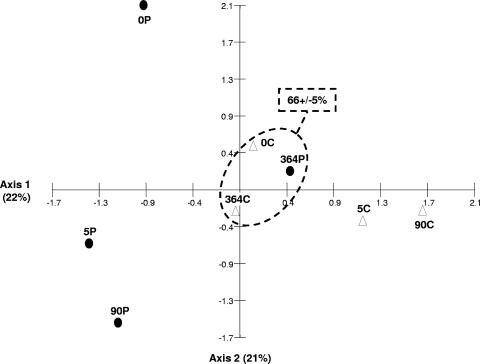
FIG. 2.
CA based on T-RFLP data (reverse-transcribed 16S rRNA) obtained from control (white triangles) and polluted (black circles) microcosms. The data analyzed correspond to averages for duplicate samples of HaeIII-digested reverse-transcribed 16S rRNA yielding 5′-end T-RFLP patterns. Each number corresponds to the day of sampling relative to the start of the experiment. Encircled symbols correspond to metabolically active bacterial communities from a control sample at the beginning of the experiment and from control and contaminated samples at the end of the experiment. Percentage values represent Bray-Curtis similarity among these samples.

