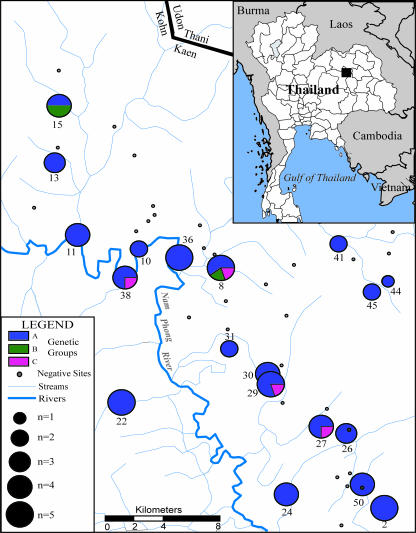
FIG. 2.
Map of regional study area within Khon Kaen Province. The figure illustrates the local watershed, as well as the locations of the 50 sites from which soil samples were collected. Each site is associated with a local village within the province. The center of each circle represents the location of a positive sampling area. Sites that were not positive for B. pseudomallei are shown as a black circle. Pie charts represent the percentages of isolates among three genetic clades (A, B, and C) for the B. pseudomallei DNA samples. The size of the pie chart is indicative of the number of samples from that site, ranging from one to five.

