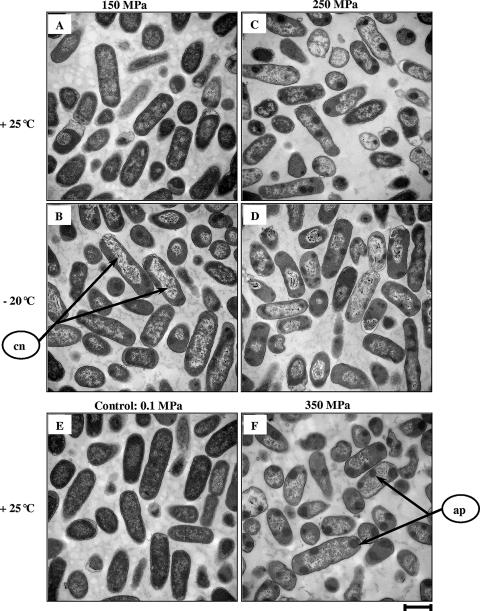
FIG. 4.
TEM micrographs of E. coli K-12TG1 cells fixed after 10-min HHP treatment. (A to D) Cells treated at 150 MPa and +25°C (A), 150 MPa and −20°C (B), 250 MPa and +25°C (C), and 250 MPa and −20°C (D). (E) Untreated cells. (F) Cells treated at 350 MPa and +25°C. Scale bar, 1 μm. Arrows show condensed nucleoids (cn) and aggregated proteins (ap).

