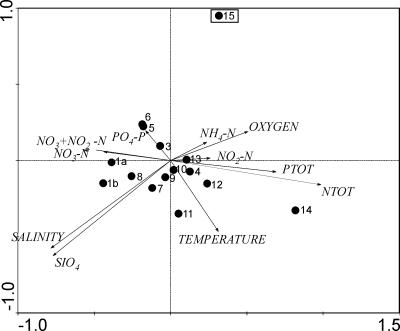
FIG. 5.
PCA plot based on the environmental parameters measured from sampling stations (values listed in Table 1). Numbers correlate to the station numbering in Fig. 1 as well as in Table 1 (station 1 was sampled twice [indicated in the PCA plot as 1a and 1b]). Low-salinity and low-silicate concentrations were the variables to explain the divergence of station 15 (station indicated with a square) from the other stations. All open-sea microcystin-producing Anabaena strains were isolated from the station 15. The first and second principal components accounted for 94.4% of the total variance.

