
Figure 3.
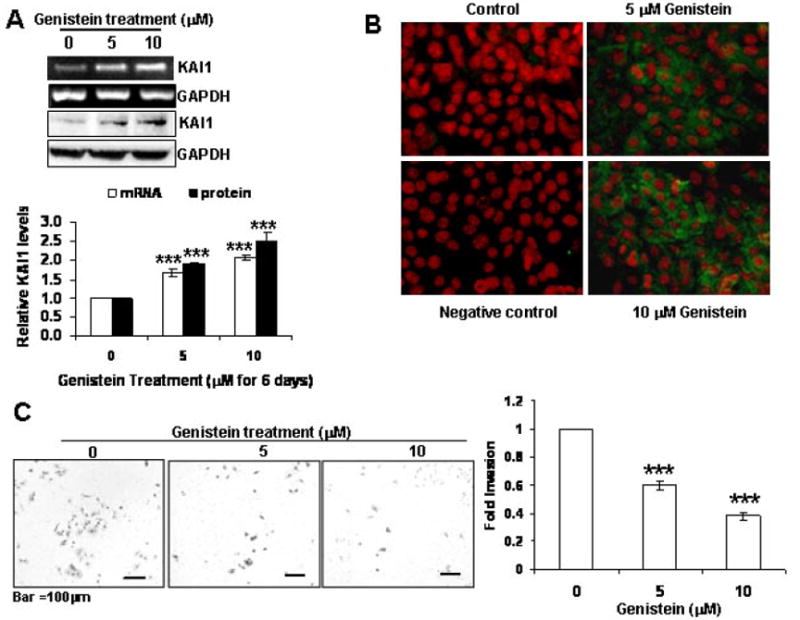
Genistein induces the expression of KAI1 in TRAMP-C2 cells and reduces their invasive potential. TRAMP-C2 cells were treated with genistein (0, 5 and 10 μM) for 7 days. A) KAI1 and GAPDH transcript and protein levels were analyzed by 1 step RT-PCR of 500 ng RNA from each treatment group and 50 μg protein lysates subjected to SDS-PAGE and immunoblotting with anti-KAI1 and anti-GAPDH antibodies to ensure for equal loading. KAI1 mRNA and protein levels were quantified from 3 independent experiments and plotted with normalization to levels in untreated TRAMP-C2 cells (down) ***, indicates p<0.001 B) KAI1 expression was examined by immunocytochemistry with anti-KAI1 antibody. TRAMP-C2 were plated on chamber slides and treated with 0, 5 or 10 μM genistein for 7 days then fixed in methanol, incubated with Anti-KAI1 antibody (or – antibody for negative control slide) and subsequently Alexa Fluor-tagged secondary antibody, counterstained with propidium iodide. Slides were then mounted and examined using a fluorescence microscope. Photographs were taken at the same magnification (20X) and then transported to Photoshop. C) Forty thousand cells from above treatments were subjected to the BD biosciences Boyden Chamber assay. The invaded cells from 3 different filters for each treatment were counted and results were plotted as fold invasion normalized to number of invaded cells in the untreated TRAMP-C2 control group. ***, indicates p<0.001. Representative photographs are on the left.