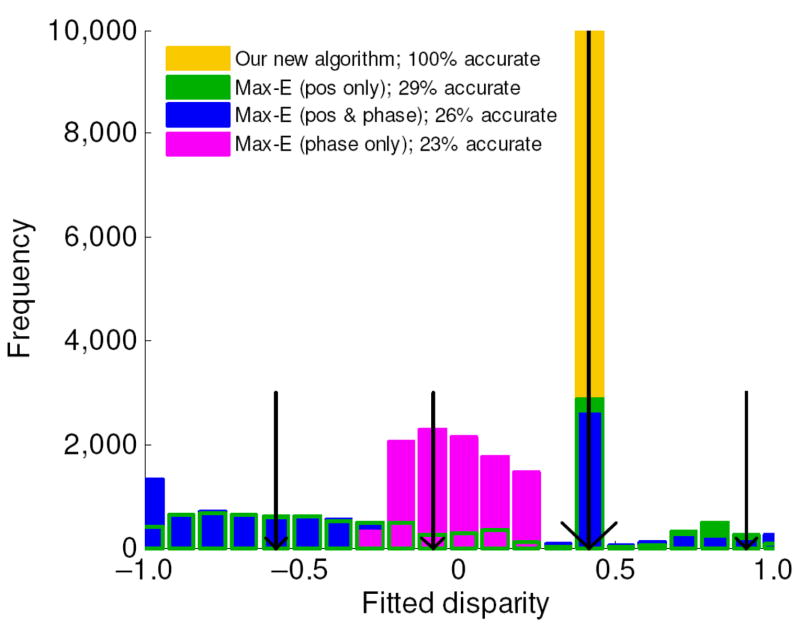
Fig. 3.
Comparison of our algorithm with four possible implementations of a maximum-energy algorithm, tested on a uniform-disparity noise stimulus. The histogram summarizes results for 10,000 noise images with a disparity of 0.42deg, marked by the large arrow. All results are for the same channel: spatial frequency f = 2cpd, orientation = vertical, bandwidth = 1.5 octaves. The shorter arrows mark disparities which are integer multiples of the spatial period away from the correct disparity. Orange: our algorithm, using both position and phase disparity detectors, always returns the correct disparity. Blue: evaluating the response of the full population, including cells with both position and phase disparity, and taking the stimulus disparity to be the preferred disparity of the maximally-responding cell (i.e. Δxpref − Δφpref/(2πf) ), gives the correct answer only 26% of the time. Green: ditto, except considering only pure position-disparity detectors (tuned-excitatory cells, Δφpref = 0); performance is similar. Purple: ditto, except considering only pure phase-disparity detectors (Δxpref = 0). This can only return answers within half a cycle of zero, i.e. ± 0.25°. “Percentage accurate” means the proportion of results which lie within the bin centered on the true disparity of 0.42°, except for the phase-disparity case (purple), where bins differing from this by integer multiples of the period 0.5° (marked with small arrows) were also considered correct.

