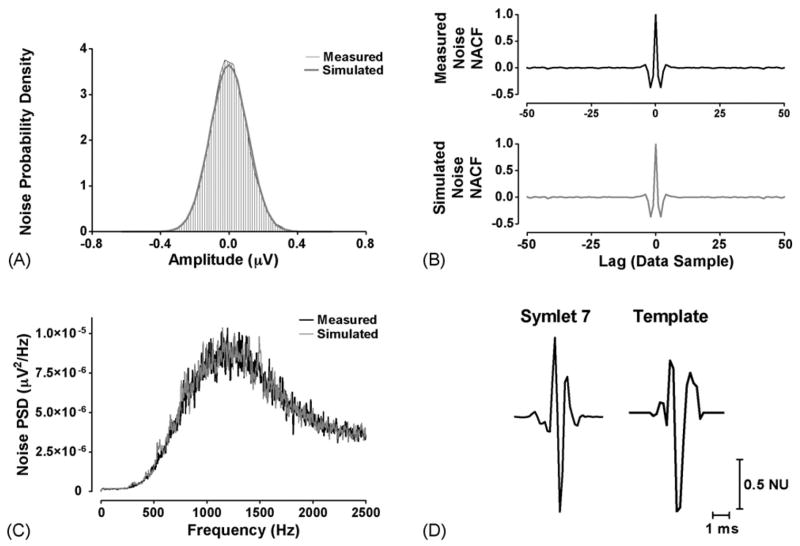
Fig. 4.
Simulation elements. (A) Histograms of the neural noise recorded during Phase IV of the Valsalva Maneuver (measured, black) and random simulated noise after application of an AR filter (simulated, gray). Both demonstrate a normal probability density. (B) The normalized autocorrelation function (NACF) of the measured (top, black) and simulated noise (bottom, gray). (C) The power spectral density (PSD) of the measured (black) and simulated (gray) noise. (D) The Symlet 7 wavelet (left) and two representative template action potentials (right) displayed in normalized units (NU).

