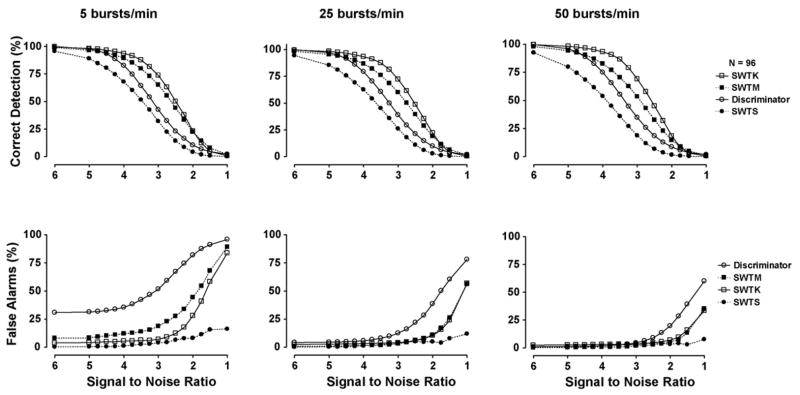
Fig. 5.
Mean results for simulations with varied noise levels and mean burst rates. The simulations tested the performance of an unsupervised amplitude discriminator (discriminator), SWT decomposition with standard (SWTS) and modified (SWTM) colored noise thresholds, SWT decomposition with two-stage kurtosis threshold (SWTK). Each point on each curve represents the mean result of 96 simulations.

