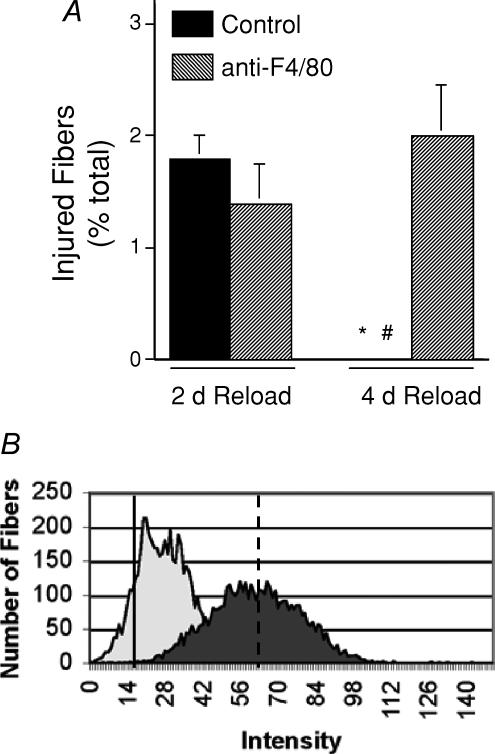
Figure 2. Macrophage depletion increases muscle fibre membrane lesions in the soleus muscles of mice subjected to 10 days of hindlimb unloading, followed by 4 days of muscle reloading.
A, data are the percentage of total fibres in the cross-sections of entire soleus muscles that were brightly fluorescent following procion orange treatment. Bars show s.e.m. *Significantly different from the anti-F4/80-injected group at the same stage of reloading; #significantly different from the 2-day reloaded group that received the same antibody treatment. B, the peaks show the aggregate data for measurements of intracellular fluorescence for all fibres in cross-sections of the entire soleus muscle from all mice in each treatment group. A rightward shift of peaks on the abscissa indicates an increase in fibres with membrane lesions. Note that the background fluorescence set at intensity = 0 was determined by measuring fluorescence at a region of the microscope slide where there was no tissue. Thus, even non-injured, ambulatory fibres displayed a small positive value for fluorescence. The dark peak shows data from anti-F4/80-treated mice after 4 days of reloading. The light peak shows data from isotype control antibody-treated mice after 4 days of reloading. Solid line shows mean fluorescence intensity of fibres from ambulatory animals. Dashed line shows mean fluorescence of fibres from isotype control IgG- and anti-F4/80-treated fibres after 2 days reloading, which did not differ between the two groups.

