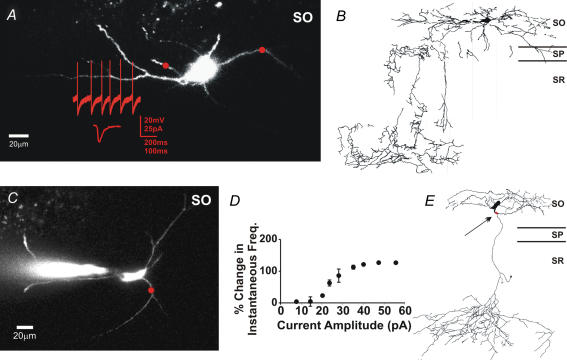
Figure 5. Morphological analysis of oriens interneurons.
A, a live image of an interneuron with current and voltage clamp traces. The red circle represents the size and location of the photolysis area. Photolysis occurred 50 ms after the trigger action potential. B, a camera lucida drawing of the same cell as in A. The axon termination identifies it as an O-LM cell. C, another live image of an interneuron with a circle indicating the location of photolysis. D, a plot of current amplitude versus change in IFF for multiple mixed AMPA–KAR current amplitudes. Points are averages of 4 trials. E, a camera lucida drawing of the same cell as in C. The axon termination identifies it as an O-LM cell.

