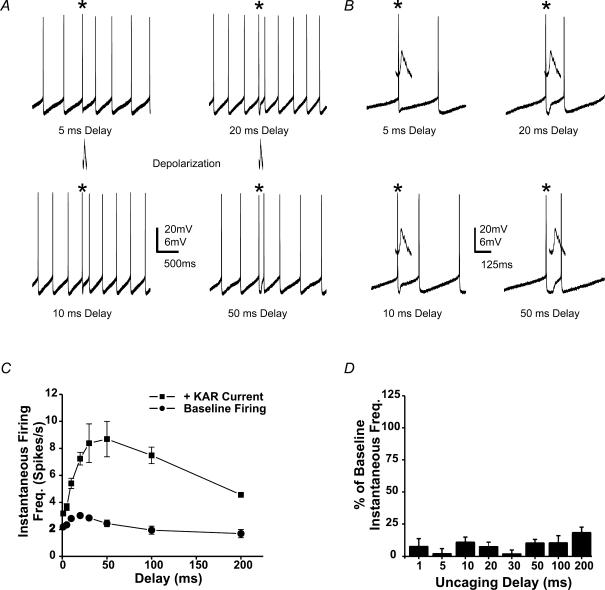
Figure 6. The timing of the glutamate current dictates the magnitude of the change in IFF.
A, current clamp traces from a spontaneously firing stratum oriens hippocampal slice interneuron. The asterisks indicate the AP triggering an uncaging pulse. The photolytic pulse (1 ms) was delivered at varied delays from the trigger AP. B, an expanded time scale for traces in A. C, a plot of the KAR-mediated increase in IFF versus the delay from the detected spike for the cell in A. Firing frequency increased with increasing delays between spike and uncaging pulse. Baseline firing rates were calculated from the average of interspike intervals in the 1 s period before the uncaging. Individual data points represent averages of 4 consecutive trials. D, IFF returns to baseline for the second AP after the uncaging pulse.

