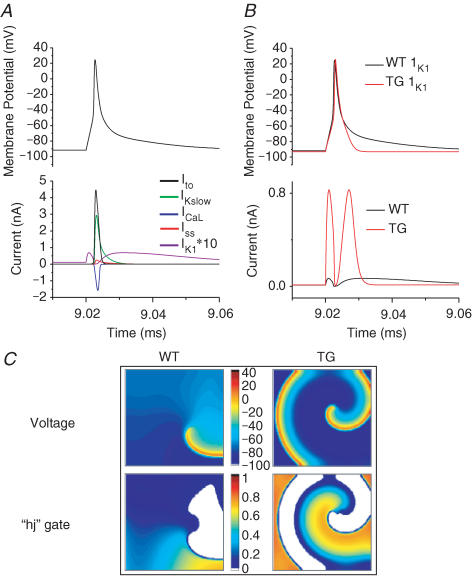
Figure 5. Simulated action potentials and reentry in WT and TG hearts.
A, simulated mouse ventricular action potential and main currents involved in repolarization. IK1 is multiplied by a factor of 10 for illustration purposes. B, action potentials and respective underlying IK1 for WT (black) and TG (red) hearts. The conductance of IK1 in TG is 12 times greater than in the WT hearts. C, spatial distribution of transmembrane voltage (top) and inactivation gating variables (‘hj’ gates, bottom) of the INa during stable reentry in a 2 cm × 2 cm cardiac cell sheet. The diastolic potential is more hyperpolarized over a wider area in the TG heart sheet (∼−94 mV), compared to the WT case (∼−90 mV). The ‘hj’ gate map shows that the maximum availability of Na+ channels in TG (0.808) exceeds that of the WT heart (0.684), and occupies a larger area during the excitable gap.

