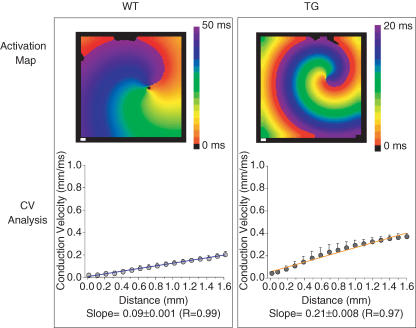
Figure 6. Conduction velocity as a function of distance from the core during reentry in computer simulations of WT (left) and TG (right) hearts.
Top, activation maps. Colour scale: WT, 0–50 ms; TG, 0–20 ms. White scale bars, 1 mm. Bottom, plots of average (± s.d.) local velocity versus distance from the core. The blue and orange lines are weighted best-fit lines. The weighted slope (±95% confidence limit) for the WT and TG hearts are 0.09 ± 0.001 (R = 0.99) and 0.21 ± 0.008 (R = 0.97), respectively. See Supplemental material for ‘WT2b2sim’ and ‘TG2b2sim’ movies.

