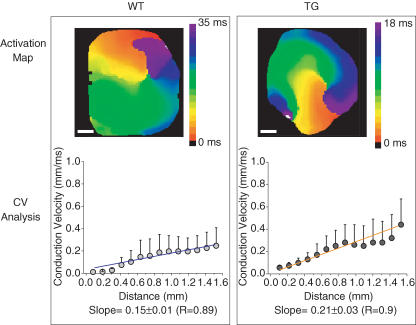
Figure 7. Experimental data of conduction velocity as a function of distance from the core during reentry in WT (left) and TG (right) hearts.
Top, activation maps. Colour scale: WT, 0–35 ms; TG, 0–18 ms. White scale bars, 1 mm. Bottom, plots of average (± s.d.) local velocity versus distance from the core. Blue and orange lines are weighted best-fit lines. The weighted slope (±95% confidence limit) for WT heart is 0.15 ± 0.01 (R = 0.89) and for TG it is 0.21 ± 0.03 (R = 0.9). See Supplemental material for examples of ‘WTrotor’ and ‘TGrotor’ movies.

