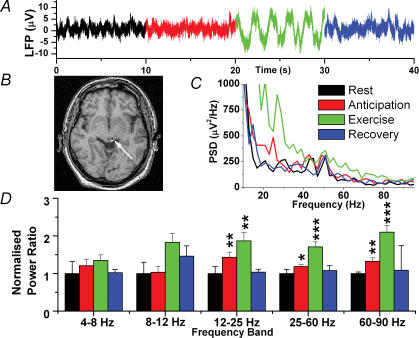
Figure 3. Local field potential changes in the PAG.
A, raw data trace. B, postoperative MR image showing a unilateral electrode in the left PAG (arrow). C, mean power spectral density for all three patients (recovery not shown for clarity). D, normalized spectral changes (rest = 1.0) divided into frequency bands. *P < 0.05, **P < 0.01, ***P < 0.001.

