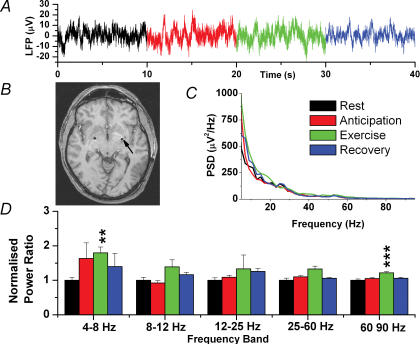
Figure 4. Local field potential changes in the GPi.
A, raw data trace. B, postoperative MR image showing bilateral electrodes in the GPi (arrow). C, mean power spectral density for all four patients (recovery not shown for clarity). D, normalized spectral changes (rest = 1.0) divided into frequency bands. **P < 0.01, ***P < 0.001.

