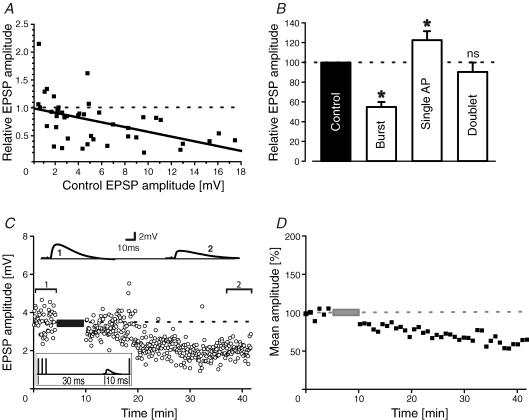
Figure 6. Burst and single spikes.
A, summary graph of relative EPSP size after conditioning versus the initial EPSP amplitude. A straight line was fitted to the data points by linear regression (r = 0.49; P < 0.0001). B, summary histogram of pairing experiments with bursts (three to four spikes), single action potentials and spike doublets (*P < 0.05; ns, not significant). C, sample traces and EPSP amplitude–time series of an experiment where EPSPs were simultaneously paired with a −20 ms burst and a +10 ms single action potential. D, 1 min averaged time course of normalized EPSP amplitudes with concomitant burst–single spike pairings (n = 6 cells).

