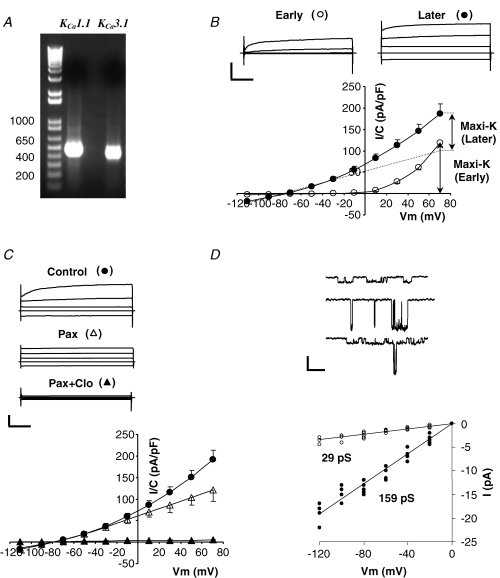
Figure 1. Analysis of whole-cell and single channel K+ currents in wild-type submandibular acinar cells.

A, expression of mRNA of IK1 and maxi-K channels in submandibular glands from wild-type mice was determined using RT-PCR analysis. B, whole-cell currents recorded with 250 nm Ca2+ in the pipette. Currents were recorded immediately (10–20 s) after achieving whole-cell mode (Early) and after a steady level of IK1 current developed (Later, 5–10 min). Top panel, typical raw currents in response to 40 ms voltage pulses to −110, −30, +10 and +50 mV from −70 mV holding potential. Calibration bars are 1 nA and 10 ms. Bottom panel, mean current densities determined at the end of the 40 ms pulses to the indicated potentials at Early (^) and Later (•) times (n = 12). Dashed line represents the voltage-independent (IK1-like) component. C, sensitivity of whole-cell currents to the maxi-K channel inhibitor paxilline and the IK1 channel inhibitor clotrimazole. Raw traces and I–V plot are presented in the same format as in B; •– no inhibitors, ▵– with 1 μm paxillin, ▴– with 1 μm paxilline and 3 μm clotrimazole (n = 7). D, top panel, single channel recordings from 3 inside-out patches exposed to 250 nm Ca2+ with either IK1 (top patch) or maxi-K (middle patch), or both (bottom patch) channels present. Bottom panel, I–V plot of single channel IK1 (^) and maxi-K (•) currents at the indicated potentials (n = 7 cells).
