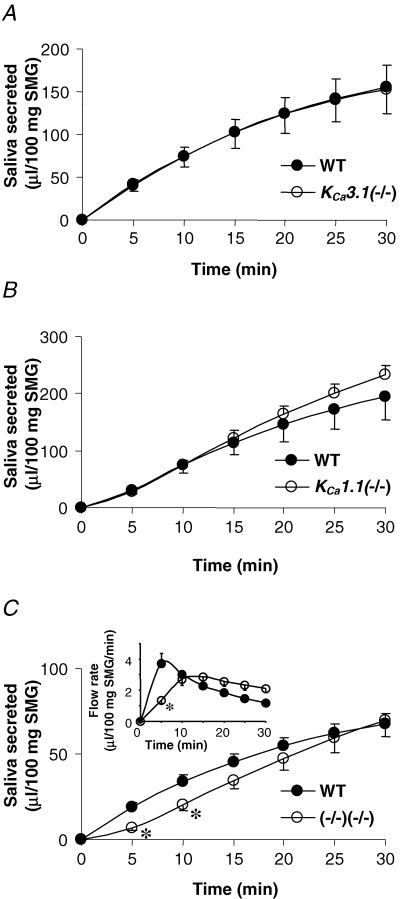
Figure 6. In vivo stimulated fluid secretion from submandibular glands.

A, amount of saliva secreted over 30 min from KCa3.1-null (^) and wild-type (•) mice in response to 10 mg (kg body weight)−1 of pilocarpine (n = 11 and 10 mice, respectively). B, saliva secreted from KCa1.1-null (^) and wild-type (•) mice (n = 7 and 6 mice, respectively). C, volume of saliva secreted from KCa3.1/KCa1.1-double-null (^) and wild-type (•) mice (n = 7 and 11 mice, respectively). Inset, respective average saliva flow rates calculated for 5 min time intervals. *P < 0.05.
