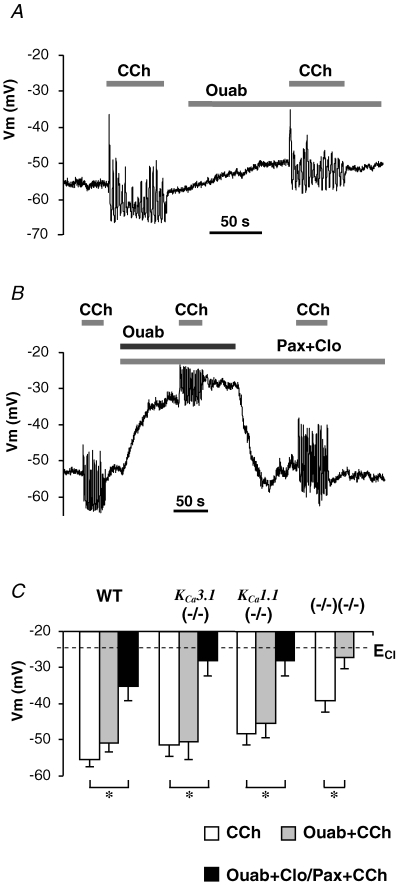
Figure 8. Membrane depolarization upon inhibition of Na+,K+-ATPase.

A and B, membrane potential traces recorded in wild-type cells stimulated with 0.3 μm CCh prior to or along with superfusion of ouabain alone (A) or with paxilline and clotrimazole (B). C, the mean values of Vm from cells during stimulation with no inhibitors (open bars), with K+ channel inhibitors (grey bars), or with both K+ channel inhibitors and Na+,K+-ATPase inhibitor (black bars). *P < 0.05.
