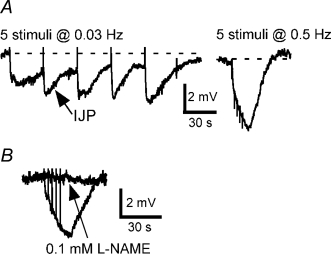
Figure 2. Intracellularly recorded electrical activity recorded in hpg vasa deferentia.

A, inhibitory junction potentials (IJPs) evoked by 5 stimuli at 0.03 and 0.5 Hz. B, overlaid traces showing responses to 5 stimuli at 0.5 Hz before and during application of l-NAME (0.1 mm) in another tissue. In A and B, the resting membrane potentials were −58 and −52 mV, respectively.
