
Figure 5. Mechanical responses of control, hpg and hpgT vasa deferentia to phenylephrine, α,β-methylene ATP and 60 mm K+.
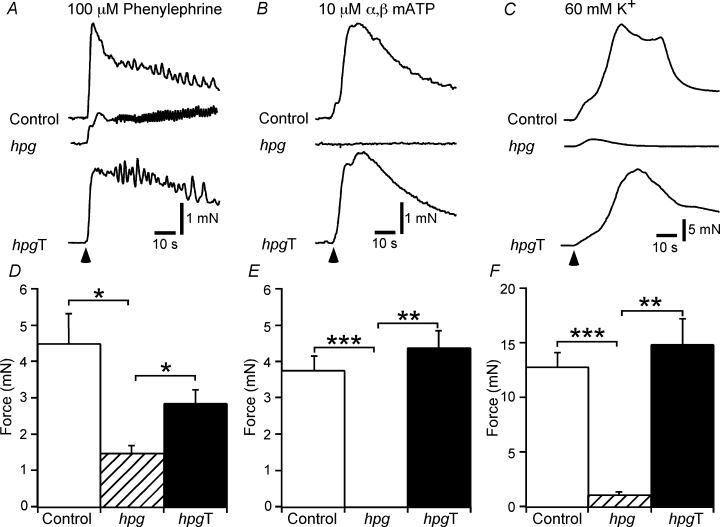
A–C, representative traces showing contractions of the circular smooth muscle of control, hpg and hpgT vasa deferentia to phenylephrine (100 μm, A), α,β-methylene ATP (10 μm, B) and 60 mm K+ (C). D–F, bar graphs showing the peak amplitude of contractions of control, hpg and hpgT vasa deferentia to phenylephrine, α,β-methylene ATP and 60 mm K+. Comparisons between the groups of tissues were made with one-way ANOVA followed by Games–Howell tests (*P < 0.05, **P < 0.01, ***P < 0.001).