
Figure 1. Suppression of hERG currents by M3 muscarinic receptor stimulation.
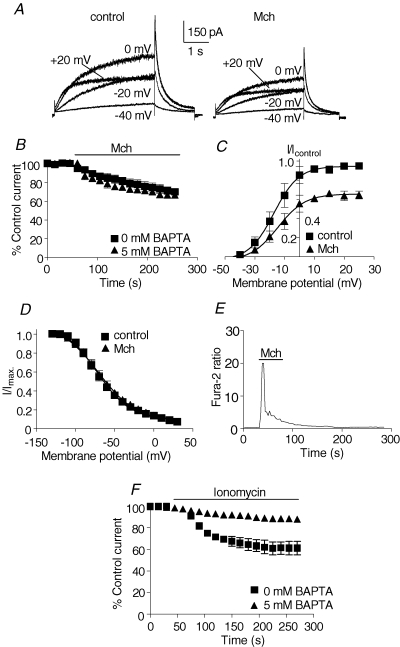
hERG channels were transiently expressed in HEK-293 cells stably expressing M3 muscarinic receptors. A, representative currents elicited with 5 s depolarizations to the indicated test potentials before (control) and during application of a maximal concentration (1 mm) of the agonist methacholine (Mch). Tail currents were obtained with repolarization to −50 mV. B, time course of response to methacholine in cells dialysed for 10 min via the patch pipette with intracellular solutions containing 0 or 5 mm BAPTA. Cells were repetitively depolarized for 5 s to 0 mV and peak tail currents measured upon repolarization to −50 mV. Values were normalized to peak tail currents before methacholine application and mean values plotted as a function of time. C, activation curves before and during application of methacholine. The V0.5,act before and after muscarinic receptor stimulation was −17 ± 2 mV and −14 ± 2 mV, respectively (n = 5). Slope factors were 8 ± 2 mV and 9 ± 2 mV before and during methacholine application, respectively. D, muscarinic receptor stimulation had no significant effects on voltage-dependent inactivation. E, representative intracellular Ca2+ response to methacholine assessed by fura-2 imaging of a single cell. The time course of the Ca2+ response is notably different from the hERG current response in B and shows the characteristic initial transient rise in Ca2+ followed by the more slowly declining component of the response. F, comparison of time-course effects of ionomycin in cells dialysed for 10 min with 0 or 5 mm BAPTA. Values were normalized to peak tail currents before ionomycin application and mean values plotted as a function of time.